What’s inside:
This blog looks at how technology can turn a reactive manual system into a proactive automated solution.
We look at the medical inventory reports that automated inventory management systems can provide.
We discuss the benefit of inventory data on healthcare management.
Wouldn’t it be amazing if all the data painstakingly being collected by inventory clerks was available at your fingertips?
For most healthcare organizations, inventory management is a very reactive process. The only way to keep on top of stock levels is to get clerks to make regular inventory rounds and for nurses to be pulled into the supply chain to flag up items in short supply.
But modern Kanban and PAR systems have not only introduced autonomy into the replenishment process, they also provide valuable information that can reduce the legwork and create a more proactive process. Choosing the right system is key, as not all automated supply management solutions provides comprehensive insights.
Let’s take a look at the day-to-day issues that Material Managers face and discover how the right data – and choosing the right dashboard – can optimize decision-making.
From a reactive to a proactive inventory management process:
Inventory Turns – how many turns is enough to get a balanced inventory?
This is the golden question every hospital struggles with.
Their management team will always aim to maintain a balanced inventory but to achieve this, replenishment has to be based on actual consumption.
They have high volumes of products that need constant tracking in order to monitor usage and ensure adequate supplies are ordered.
So the big questions are:
- Do inventory clerks have any hope of capturing accurate usage data?
- Is there a way to keep an eye on supplies and avoid stock-outs without manual counts?
- In which cases is it better to increase the inventory rounds and in which cases is it better to increase the quantity available on the shelf?
To answer these questions, you need the right data and the right dashboard that can analyze inventory rotation information by item according to the defined time period. It will need to formulate the right ratio between the number of turns and the amount of inventory for each item, for example:
When the usage data shows high consumption and too many completions turns around these particular items, it suggests increased replenishment would reduce the number of inventory clerk rounds.
When there are too many items on the shelf compared to actual consumption, the recommendation would be to reduce stock levels and save valuable space.
This metric enables the materials management team to maintain a balanced inventory, based on actual consumption.
Average Days to Restock – Where are the ‘bottlenecks’ in the process?
But as jaded materials managers know, particularly in these days of disrupted supply chains, placing the order is one thing, but receiving it is another!
Is there a way for the materials management team to track how long it takes from the point of requisition to delivery? For each product?!
Can they determine which products have longer delivery timescales so that they can anticipate this and adjust their orders accordingly so that stock-outs are avoided?
The right dashboard provides an `Average Days to Restock` report which helps the supply chain management team to review the effectiveness of inventory teams on the ground.
- It shows where there are ‘bottlenecks’ in the process
- Does it highlight supply chain inefficiencies, such as long re-order timescales?
- It prompts action on improving the weak points identified.
Once issues have been identified, action can be taken to deal with these or at least to anticipate and manage them.
Restock Frequency – What is more profitable? Frequent restocking or purchase & store inventory on-shelf?
- How many times has the inventory clerk approached that bin in order to refill it? What is the cost of each round? And in which items are more profitable to purchase and store on the shelf, and in which items it’s better to add inventory rounds?
- What if it was possible to respond to usage patterns with appropriate stock levels that reduced restock frequency?
- The right dashboard provides `Restock Frequency Report` analyses that help management determine for each item, how many times a specific Kanban or PAR bin is refilled? and what is more cost-effective?
Through this data, the management team can balance the amount of inventory according to its monetary value.
Let’s take for example a case in which inventory clerks replenished 57% of supplies less than once a month, This is a good result for low-value supplies.
In another case, this report may highlight that 7% of items were refilled by clerks more than 5 times a month then this merits attention as the item is labor-intensive.
This report, therefore, helps materials management teams to determine the preferred balancing point. This would be set based on many factors including the value of the supplies. For example, where multiple stock refills are required, it may be sensible to get more inventory on the shelves to reduce restocking rounds. On the other hand, for more expensive items, it may be more cost-effective to lower the inventory level and increase the number of inventory rounds.
Zero Turn Items – getting rid of dead SKU’s!
Hospital store rooms are often crowded and disorganized due to too many items being stored in a limited space. Some items spill out into the corridors and are not securely stored. So can data help us with this problem?
- Is it possible to identify items sitting on the shelves unused?
- Can we find a way to free up some space in the storage room?
- Can supplies rooms be better organized?
The right dashboard will know to identify ineffective parts of the process, such as in the `Zero Turn Items Report` which emphasizes exceptional items that have not had a single refill – at the monthly level, and cumulative over the year.
It is possible to analyze the cause of zero restocks – if this was due to overstocking then the recommendation would be to lower the restock quantity.
Another reason could be that the item is no longer in use and can then be removed from the shelf.
At the annual cumulative level, the management team can easily locate “Dead SKUs” that have not been refilled at all over the past year. The goal is to remove those items and free up shelf space for other alternatives as required by clinical staff.

The perfect dashboard that makes life easier
Keeping track of medical supplies across a large healthcare organization takes so much time and energy, yet despite all efforts, it’s hard to get right.
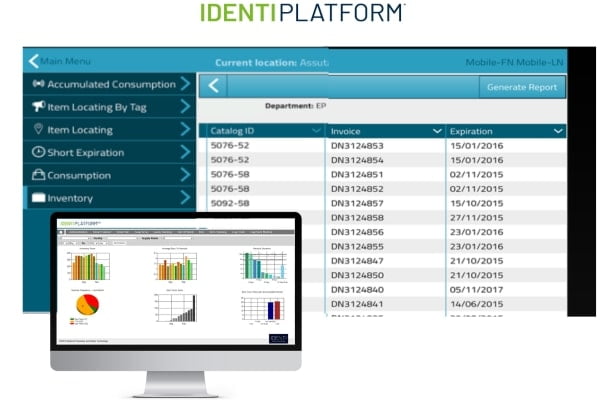
The IDENTI Kanban & PAR system provides an automated inventory management system for bulk items with a built-in integrated dashboard, that give Material Managers management teams all the data and analysis they need to manage their inventory with ease and make data-driven based decisions. And more importantly in a way that takes nurses out of the inventory management process.
Find out more about IDENTI’s automated Kanban and PAR solutions and its managing software.


